When systems are described on a higher level of abstractions, block diagrams can be used for their representation. Control systems are often represented using such description. A transfer function in s-domain of one subsystem (block) can be represented as a rational function:
![]()
Such expressions can be realized as shown in Fig. 5.12, when the control form representation is used.
Fig. 5.12: Control form representation.
When writing transfer function module, we are using modules that describe smaller blocks in Fig. 5.12. For instance, integrator block is represented through:
module integral (flow fin, fout) {
action (double w=1.0) {
process per_iteration {
eqn fout: { fout } - w * idt { fin } = 0;
}
}
}
The command clone was used to model an array of integrators, as well as gain stages that create inputs to the adders. This is contained inside the module transfer (not given here), representing the block scheme from the Fig. 5.12.
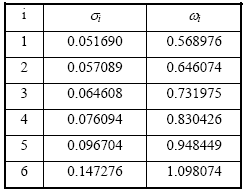
As an example of continuous-time system simulation the response of a pulse compressing allpass filter will be evaluated. The transfer function of the circuit is given by

(σ, ω) i being the pole/zero coordinates as given in Table 5.1.
Table 5.1


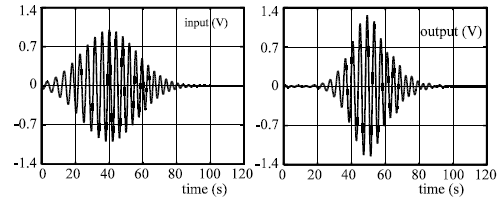
Fig 5.13.a: The input signal Fig 5.13.b: The output signal
The input signal is frequency modulated and gaussian shaped:
![]()
where ω 0 = 1.52344, a = 0.11033215 and b = 0.25794107 [Laz72], given in Fig 5.13.a.
The output (amplified and monochromatic) signal as obtained by simulation is depicted in Fig 5.13.b.
Here, again, the clone command was used in order to replicate the basic second order allpass cell six times.